Saving the best for last: Panel
![]()
December 3, 2020
Final project details: https://github.com/MUSA-550-Fall-2020/final-project
You will likely need to navigate to localhost:5000 instead of http://0.0.0.0:5000
Note: the web address http://0.0.0.0 is an alias for "localhost" — this means the web server is running locally on your computer.
Let's modify the Altair-based Dash app for the shootings data in Philadelphia to include a dropdown that allows the user to specify which race to show data for.
Steps
Dropdown object in Dash's core component library: https://dash.plot.ly/dash-core-components/dropdownDiv element that contains the Dropdown elementrender() function to accept the value of the race dropdown as an input to the function — then, you can use that value to select the appropriate subset of your data frame to plot!See this Dash app, which adds a dropdown element for race of the shooting victim.
From the Jupyter Terminal or the Termina/Anaconda Prompt apps:
cd dash-folium
python app.py
to start the example
Right now: Panel
Goal: a Python-based solution with server support where visualizations from different libraries can interact with each other
![]()
Crucial feature: supports live dashboarding code in a Jupyter notebook and deploying same code to a server
Only library to support entire data wrangling workflow in a Jupyter notebook
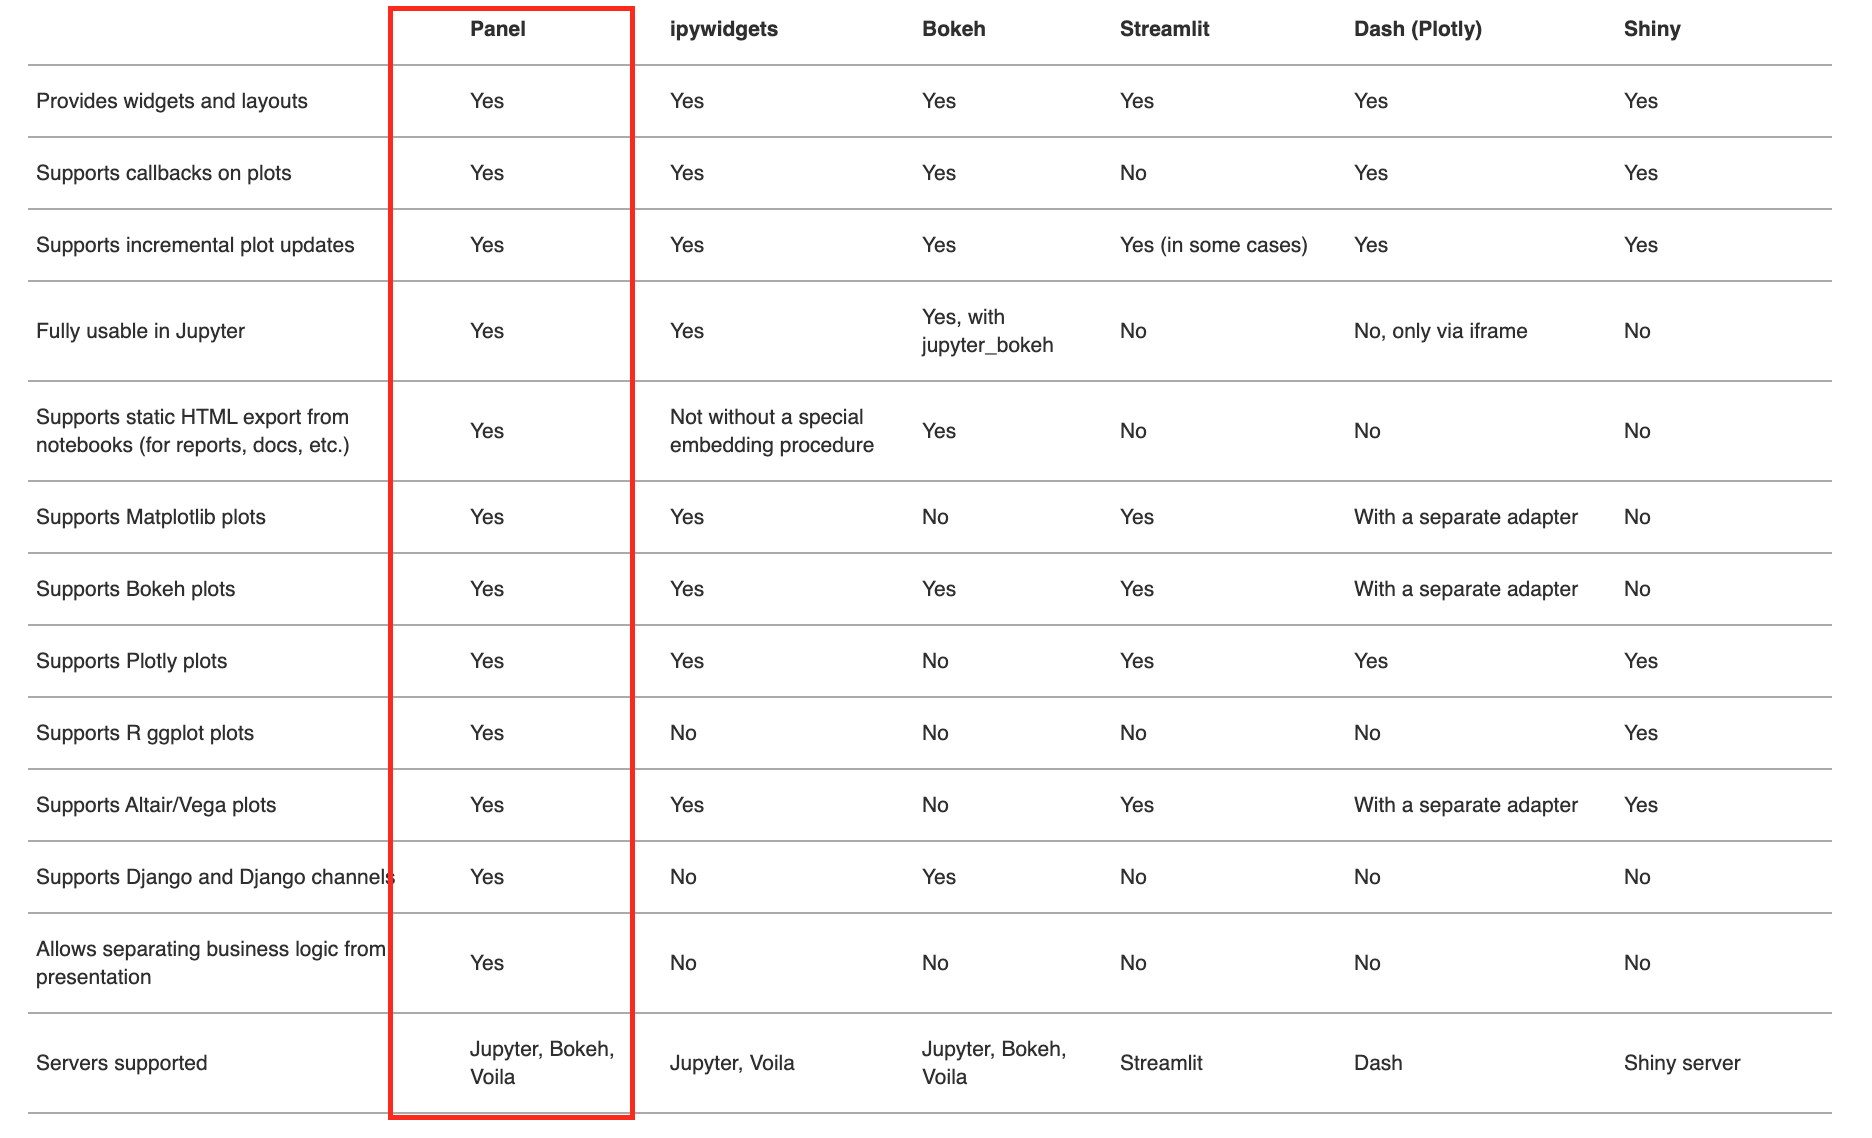
See Panel FAQ

Also important: Panel provides only support for Datashader and visualizing large datasets
We'll walk through two examples that can serve as reference/templates for the final project:
PyData talk in Dec 2019 from the creator of Panel:
Let's take a quick look at this nice tutorial