from matplotlib import pyplot as plt
import numpy as np
import pandas as pd
import geopandas as gpd
np.random.seed(42)
December 1, 2020
We'll discuss ways to translate our analysis results to the Web in a meaningful way. We'll cover three methods to do so, each with their own pros and cons:
Last lecture
This lecture
Next week
Last time, we covered:
We reviewed examples of how to save interactive charts using the following packages:
Steps:
Notes
A few quick basics before we move on to interactive Web apps with Dash...
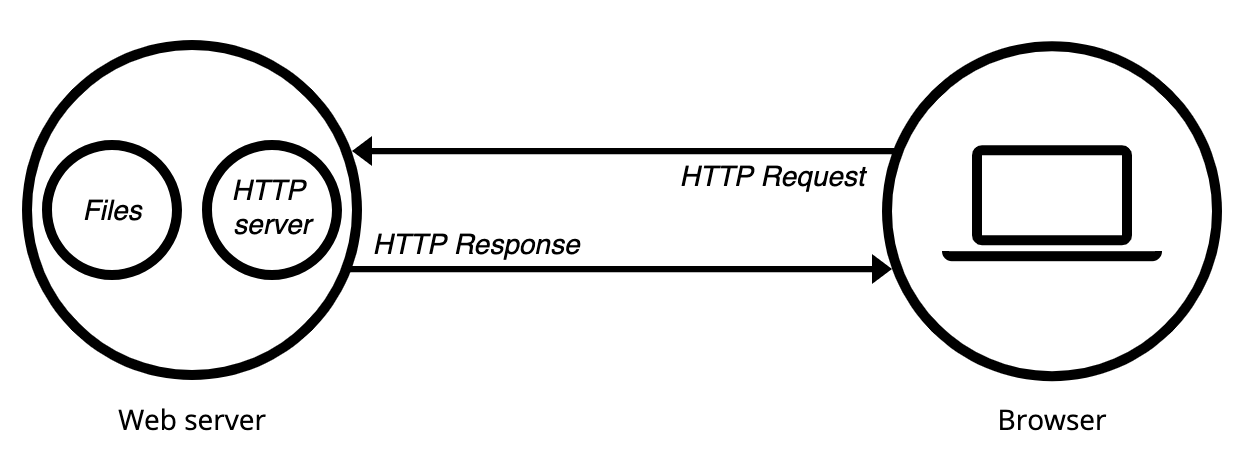
Static and dynamic
For more information: Mozilla documentation

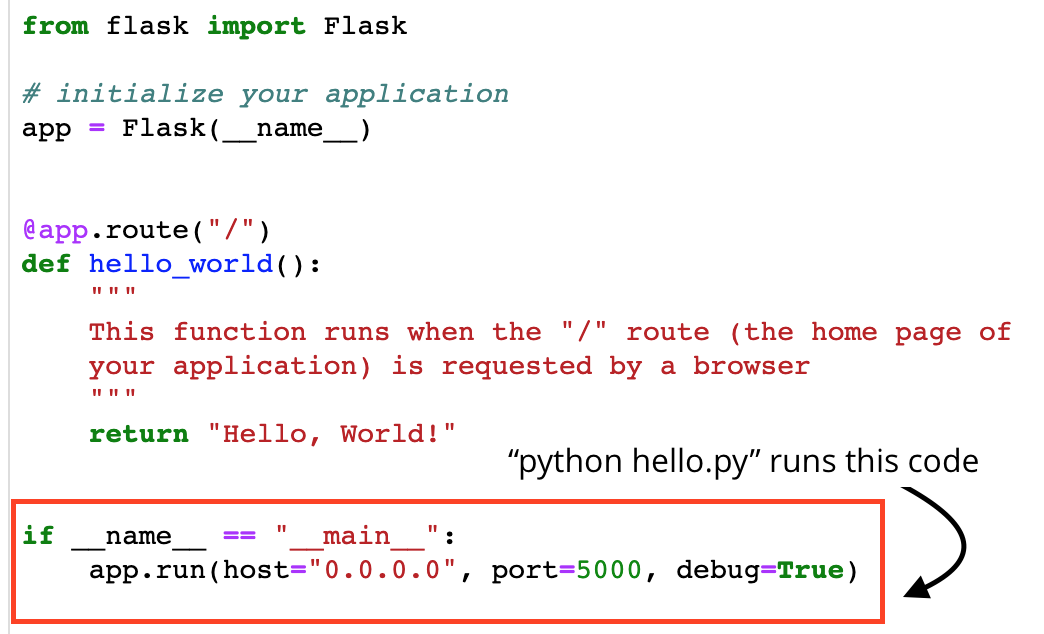
A very lightweight package for framework for dynamic web apps
To start up our Flask app, we'll need to execute the Python script from the command line. We have two options for that...

Important: this won't work on Binder, it needs to be running on your local machine
Run the following commands from within the Terminal window in Jupyter notebook:
cd hello-flask
python hello.py

*.py fileif __name__ == '__main__': gets executedStackOverflow answer about the if-name-main syntax in Python.
There are sometimes Anaconda-related issues where "python" will point to the wrong version of Python. You can double check by running:
which pythonfrom the Jupyter Terminal interface. This should print out a path name that includes the name of our Python environment (musa-550-fall-2020)
Navigate in the browser to: http://0.0.0.0:5000
You should see the text: "Hello, World!"
You will likely need to navigate to localhost:5000 instead of http://0.0.0.0:5000
Note: the web address http://0.0.0.0 is an alias for "localhost" — this means the web server is running locally on your computer.
Try editing the hello.py file in your editor, saving, and re-loading the application page. You should see the app update to reflect the changes!
templates/ directoryhello-template.py app loads the templates/hello.html when the /hello/ route is requested by the browserFlask code: hello-template.py
python hello-template.py
The main page ("/") renders the same thing as the previous app ("Hello, World!").
Navigate to the "/hello/" route and you should see:

hello-api.py: a more sophisticated example using request parameters
Run:
python hello-api.py
Flask code: hello-api.py
This returns the number of fatal/nonfatal shootings in the past X "days"

Steps:
port=5000 keyword when initialize the app in the Python scriptThe result of Python programmers asking the question: can we build a dashboard just in Python?
The answer is yes...for the most part.
You still need to use some CSS styling and know about different HTML elements. But everything is coded in Python.
In your Python Dash app, there are two main steps:
dash_html_components module# The standard import
import dash_html_components as html
html.Div([
html.H1('Hello Dash'),
html.Div([
html.P('Dash converts Python classes into HTML'),
html.P('This conversion happens behind the scenes by Dash's JavaScript front-end')
])
])This gets converted automatically to the following HTML in your web app:
<div>
<h1>Hello Dash</h1>
<div>
<p>Dash converts Python classes into HTML</p>
<p>This conversion happens behind the scenes by Dash's JavaScript front-end</p>
</div>
</div>dash_core_components module# The standard import for these components
import dash_core_components as dcc
Use the dcc.Markdown() object to automatically convert Markdown into HTML in your web apps!
The core components and HTML components in Dash remove most of the direct HTML/CSS, but still good to know some of the basics:
Useful to keep these references handy if you are unsure about syntax for HTML and/or CSS
Key: any valid ".html" block can be embedded within an "IFrame" element
Two examples in the "dash-altair/" folder...
