from matplotlib import pyplot as plt
import numpy as np
import pandas as pd
import geopandas as gpd
np.random.seed(42)
November 24, 2020
Final project due: 5pm on Monday, December 21st
We'll discuss ways to translate our analysis results to the Web in a meaningful way. We'll cover three methods to do so, each with their own pros and cons:
Today: we'll focus on the first two today and cover Panel in detail in week 14
To start, let's recap three ways that we've learned to produce interactive charts in the course:
Load the data from week 2:
url = "https://raw.githubusercontent.com/MUSA-550-Fall-2020/week-2/master/data/measles_incidence.csv"
data = pd.read_csv(url, skiprows=2, na_values="-")
data.head()
| YEAR | WEEK | ALABAMA | ALASKA | ARIZONA | ARKANSAS | CALIFORNIA | COLORADO | CONNECTICUT | DELAWARE | ... | SOUTH DAKOTA | TENNESSEE | TEXAS | UTAH | VERMONT | VIRGINIA | WASHINGTON | WEST VIRGINIA | WISCONSIN | WYOMING | |
|---|---|---|---|---|---|---|---|---|---|---|---|---|---|---|---|---|---|---|---|---|---|
| 0 | 1928 | 1 | 3.67 | NaN | 1.90 | 4.11 | 1.38 | 8.38 | 4.50 | 8.58 | ... | 5.69 | 22.03 | 1.18 | 0.4 | 0.28 | NaN | 14.83 | 3.36 | 1.54 | 0.91 | 
| 1 | 1928 | 2 | 6.25 | NaN | 6.40 | 9.91 | 1.80 | 6.02 | 9.00 | 7.30 | ... | 6.57 | 16.96 | 0.63 | NaN | 0.56 | NaN | 17.34 | 4.19 | 0.96 | NaN | 
| 2 | 1928 | 3 | 7.95 | NaN | 4.50 | 11.15 | 1.31 | 2.86 | 8.81 | 15.88 | ... | 2.04 | 24.66 | 0.62 | 0.2 | 1.12 | NaN | 15.67 | 4.19 | 4.79 | 1.36 | 
| 3 | 1928 | 4 | 12.58 | NaN | 1.90 | 13.75 | 1.87 | 13.71 | 10.40 | 4.29 | ... | 2.19 | 18.86 | 0.37 | 0.2 | 6.70 | NaN | 12.77 | 4.66 | 1.64 | 3.64 | 
| 4 | 1928 | 5 | 8.03 | NaN | 0.47 | 20.79 | 2.38 | 5.13 | 16.80 | 5.58 | ... | 3.94 | 20.05 | 1.57 | 0.4 | 6.70 | NaN | 18.83 | 7.37 | 2.91 | 0.91 | 
5 rows × 53 columns
Use the pandas.melt() function to convert it to tidy format:
annual = data.drop('WEEK', axis=1)
measles = annual.groupby('YEAR').sum().reset_index()
measles = measles.melt(id_vars='YEAR', var_name='state', value_name='incidence')
measles.head()
| YEAR | state | incidence | |
|---|---|---|---|
| 0 | 1928 | ALABAMA | 334.99 | 
| 1 | 1929 | ALABAMA | 111.93 | 
| 2 | 1930 | ALABAMA | 157.00 | 
| 3 | 1931 | ALABAMA | 337.29 | 
| 4 | 1932 | ALABAMA | 10.21 | 
Now let's load altair:
import altair as alt
# use a custom color map
colormap = alt.Scale(
    domain=[0, 100, 200, 300, 1000, 3000],
    range=[
        "#F0F8FF",
        "cornflowerblue",
        "mediumseagreen",
        "#FFEE00",
        "darkorange",
        "firebrick",
    ],
    type="sqrt",
)
# Vertical line for vaccination year
threshold = pd.DataFrame([{"threshold": 1963}])
# plot YEAR vs state, colored by incidence
chart = (
    alt.Chart(measles)
    .mark_rect()
    .encode(
        x=alt.X("YEAR:O", axis=alt.Axis(title=None, ticks=False)),
        y=alt.Y("state:N", axis=alt.Axis(title=None, ticks=False)),
        color=alt.Color("incidence:Q", sort="ascending", scale=colormap, legend=None),
        tooltip=["state", "YEAR", "incidence"],
    )
    .properties(width=650, height=500)
)
rule = alt.Chart(threshold).mark_rule(strokeWidth=4).encode(x="threshold:O")
out = chart + rule
out
Altair plots can be fully represented as JSON data. This makes them very easy to embed on websites, as we shall soon see!
# save the chart as JSON
out.save("measlesAltair.json") 
# save the chart as HTML
out.save("measlesAltair.html")
Now, let's compare the HTML and JSON files...
import hvplot.pandas
import hvplot
# Make the heatmap with hvplot
heatmap = measles.hvplot.heatmap(
    x="YEAR",
    y="state",
    C="incidence", # color each square by the incidence
    reduce_function=np.sum, # sum the incidence for each state/year
    frame_height=450,
    frame_width=600,
    flip_yaxis=True,
    rot=90,
    colorbar=False,
    cmap="viridis",
    xlabel="",
    ylabel="",
)
# Some additional formatting using holoviews 
# For more info: http://holoviews.org/user_guide/Customizing_Plots.html
heatmap = heatmap.redim(state="State", YEAR="Year")
heatmap = heatmap.opts(fontsize={"xticks": 0, "yticks": 6}, toolbar="above")
heatmap
type(heatmap)
holoviews.element.raster.HeatMap
HTML is are only option here...
import hvplot
hvplot.save(heatmap, 'measlesHvplot.html')
import osmnx as ox
Identify the lat/lng coordinates for our places of interest: Use osmnx to download the geometries for the Libery Bell and Art Museum
philly_tourism = ox.geometries_from_place("Philadelphia, PA", tags={"tourism": True})
art_museum = philly_tourism.query("name == 'Philadelphia Museum of Art'").squeeze()
art_museum.geometry
liberty_bell = philly_tourism.query("name == 'Liberty Bell'").squeeze()
liberty_bell.geometry
# Liberty Bell coords
liberty_bell_coords = (liberty_bell.geometry.y, liberty_bell.geometry.x)
# Art Musuem coords
art_museum_coords = (art_museum.geometry.centroid.y, art_museum.geometry.centroid.x)
Get the street graph in Center City: Use osmnx to download the street network around City Hall.
G = ox.graph_from_address('City Hall, Philadelphia, USA', 
                          dist=1500, 
                          network_type='drive')
Identify the nodes in the graph closest to our points of interest.
# Get the origin node
orig_node = ox.get_nearest_node(G, liberty_bell_coords) 
# Get the destination node
dest_node = ox.get_nearest_node(G, art_museum_coords) 
Use networkx to find the shortest path
import networkx as nx
# Calculate the shortest path between these nodes
route = nx.shortest_path(G, orig_node, dest_node)
# The underlying graph of streets
graph_map = ox.plot_graph_folium(G, popup_attribute='name', edge_width=2)
# Plot the route with folium on top of the previously created graph_map
route_graph_map = ox.plot_route_folium(G, route, route_map=graph_map)
Just use the save() function!
route_graph_map.save("foliumChart.html")
from IPython.display import IFrame
# Display the HTML file in the notebook
IFrame("foliumChart.html", width=600, height=500)
We can embed them on GitHub Pages...
The structure of the URL for the rendered page is:
https://[USERNAME].github.io/[REPOSITORY NAME]
Note: you can create a new website for every repository, so this will work even if you have a personal Github Pages website set up.

For more information, see this guide on creating a repository from a template.

On the home page for your new repository go to "Settings":

https://[USERNAME].github.io/[REPOSITORY NAME]
_config.yml file.For more information on the config file, see the documentation.
_posts directory will be automatically uploaded and publishedTo add new posts, simply add a file in the _posts directory that:
YYYY-MM-DD-name-of-post.extYou can take a look at the source for the existing posts in the _posts folder to get an idea about how it works.
These are just normal PNG images — we can use Markdown's syntax for embedding images.


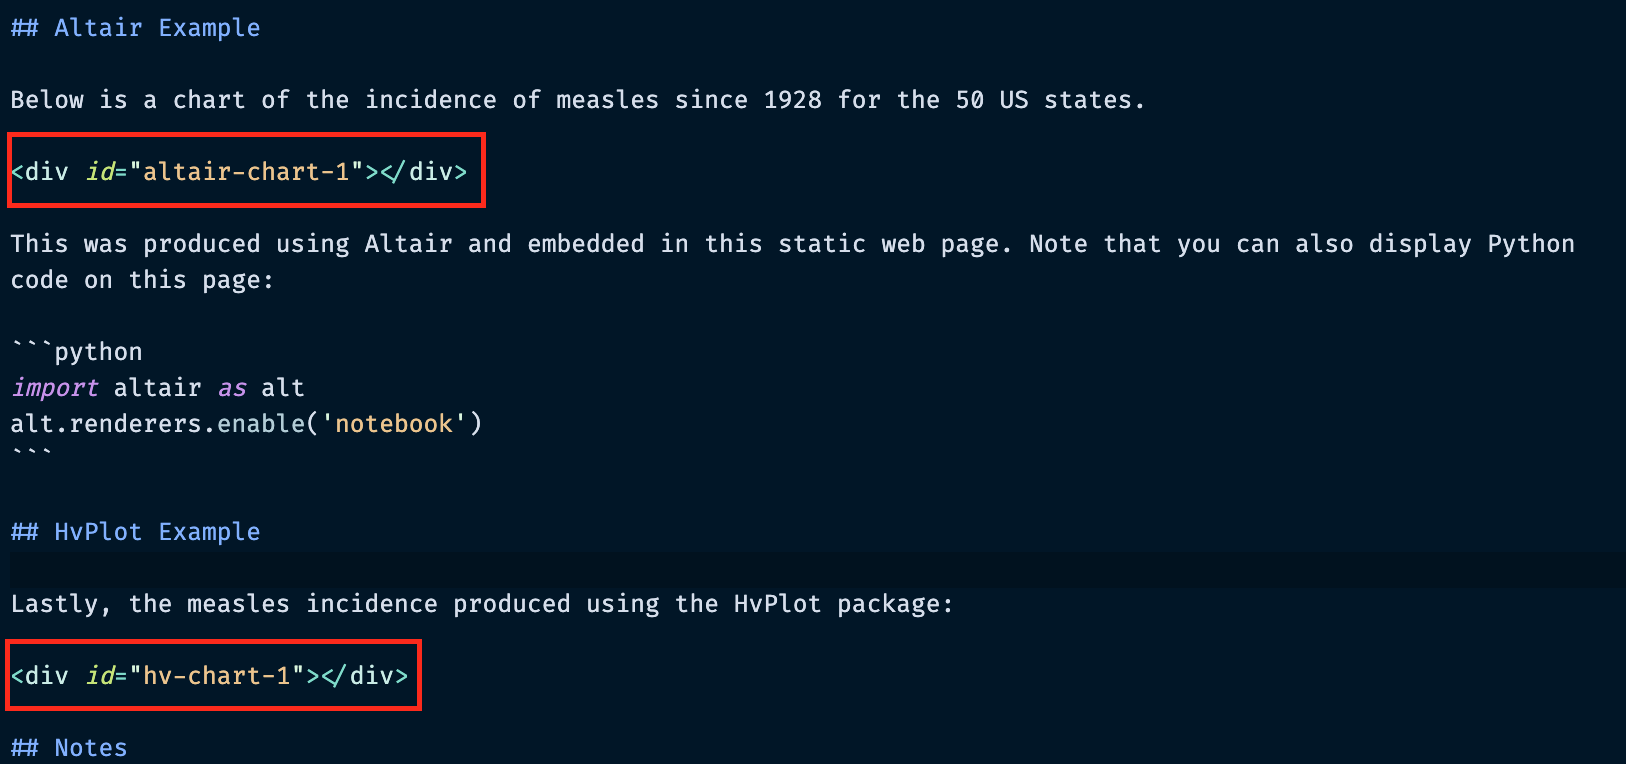
Under the altair-loader and hv-loader we need to specify two things:
This should be specified as key: value pairs, for example:
altair-chart-1: "charts/measlesAltair.json"
In this case altair-chart-1 is the CSS identifier and  "charts/measlesAltair.json" is the name of the file to load.
Note: there must be a matching "div" element with the same CSS identifier — this is where the chart will be embedded!

Rendered: https://musa-550-fall-2020.github.io/github-pages-starter/folium-charts/

For the folium-loader, the syntax is:
CSS identifier for chart : ["chart file path", "width of chart in pixels"]
Again, there must be a matching "div" element with the same CSS identifier — this is where the chart will be embedded!

There's a lot of extra stuff we don't actually need. The most important files/folders are:
_config.yml: the main configuration file for the site, where you can change names, titles, etc_posts/: where the markdown posts (your content!) goassets/images/: where you can place your static matplotlib-generated PNG filescharts/: where you can place your .html or .json files from Altair/Hvplot/FoliumSteps:
_posts folderNotes
vega_datasets packageimport altair as alt
from vega_datasets import data
source = data.gapminder_health_income.url
source
'https://vega.github.io/vega-datasets/data/gapminder-health-income.csv'
data = pd.read_csv(source)
data.head()
| country | income | health | population | |
|---|---|---|---|---|
| 0 | Afghanistan | 1925 | 57.63 | 32526562 | 
| 1 | Albania | 10620 | 76.00 | 2896679 | 
| 2 | Algeria | 13434 | 76.50 | 39666519 | 
| 3 | Andorra | 46577 | 84.10 | 70473 | 
| 4 | Angola | 7615 | 61.00 | 25021974 | 
chart = alt.Chart(data).mark_circle().encode(
    alt.X('income:Q', scale=alt.Scale(type='log')),
    alt.Y('health:Q', scale=alt.Scale(zero=False)),
    size='population:Q', 
    tooltip=['income:Q', 'country', 'health']
).interactive()
chart
chart.save("gapminderChart.json")
Remember: we can save altair charts as JSON files and use the altair-loader to directly load the JSON representation.