MUSA 550: Geospatial Data Science in Python

      Nick Hand

      Director of Finance, Data, and Policy, Philadelphia Controller

      • Philadelphia

      Example: Embedding Matplotlib Images

      On this page

      • Section 1
        • Abandoned Cars

      Section 1

      This is an example post. The posts are written in markdown.

      Abandoned Cars

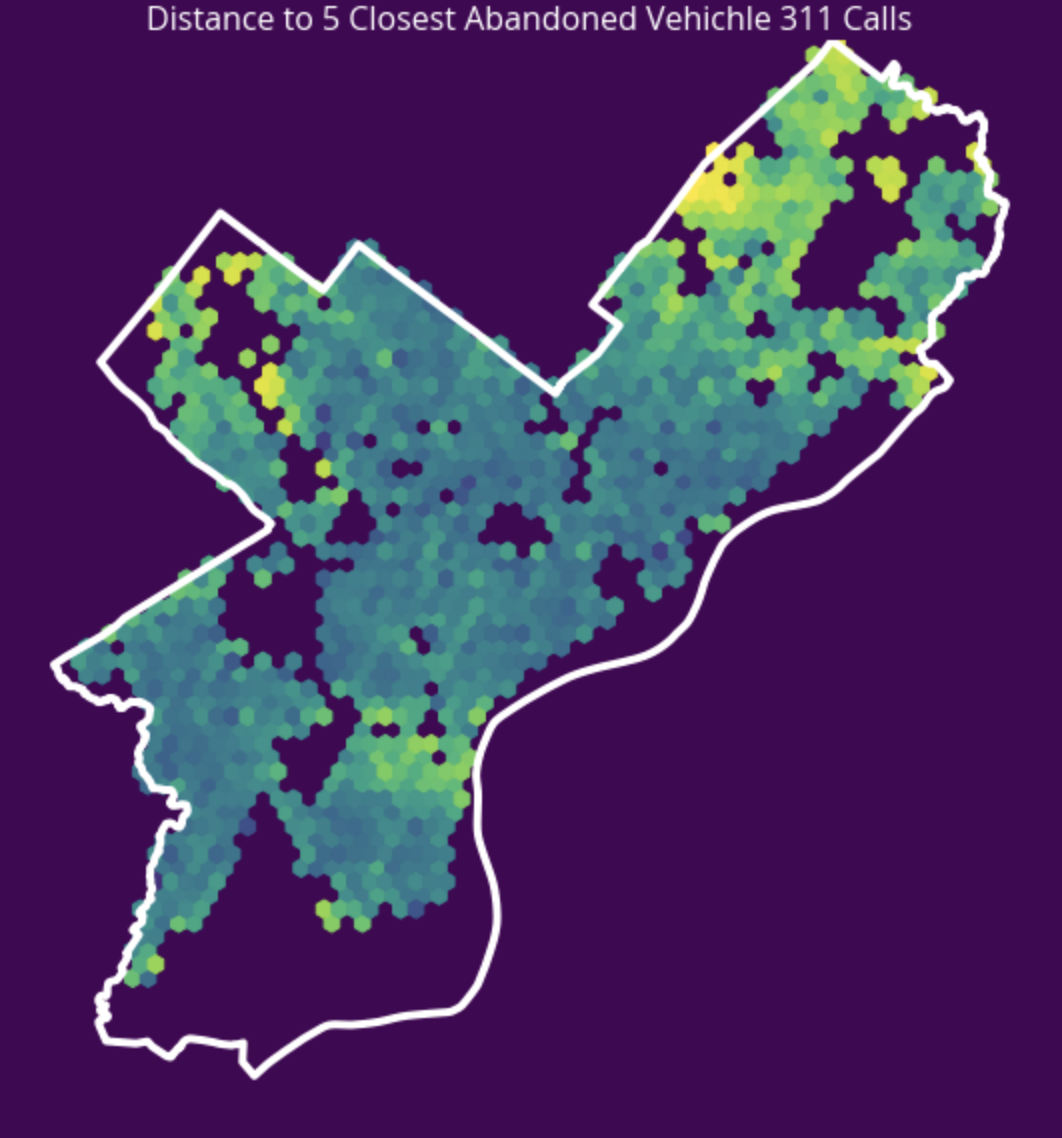
      Below, we show the distance between residential sales and the average distance to the 5 nearest 311 calls for abandoned cars.

      distances-abandoned-cars

      Tags: dataviz, matplotlib

      Updated: April 17, 2019

      Share on

      Twitter Facebook LinkedIn
      Previous Next

      You may also enjoy

      Welcome to GitHub Pages!

      You’ll find this post in your _posts directory. Go ahead and edit it and commit your changes to to the repository. GitHub will automatically rebuild your sit...

      Example: Embedding Altair & Hvplot Charts

      Embedding interactive charts on static pages using Jekyll.

      Example: Embedding Folium charts

      Embedding interactive Folium charts on static pages using Jekyll.
      • Follow:
      • Feed
      © 2020 Nick Hand. Powered by Jekyll & Minimal Mistakes.